Understanding PRISMA Flow Diagram 2020
When writing a systematic review and meta-analysis, researchers must adhere to the Preferred Reporting Items for Systematic Reviews and Meta-Analyses (PRISMA) checklist. The PRISMA statement, published in 2009, assists researchers in reporting the rationale, methods, and findings of their reviews. Moreover, in the results section, it is essential to include the PRISMA Flow Diagram 2020, which visually represents the process of identifying relevant published data and determining their inclusion in the review. This diagram allows readers to easily comprehend the number of studies screened and included, enhancing the reporting quality of systematic reviews and meta-analyses.
You are required to draw the PRISMA flow diagram in the results part of your systematic review. The flow diagram or flow chart shows the process you used to find published data on the topic and how you decided whether to include it in the review.
Through the PRISMA diagram, the reader can easily see how many studies were screened, how many were included, and what exclusion method the author used. The main aim of the PRISMA diagram is to help writers improve the reporting of systematic reviews and meta-analyses.
Stages of PRISMA Flow Diagram
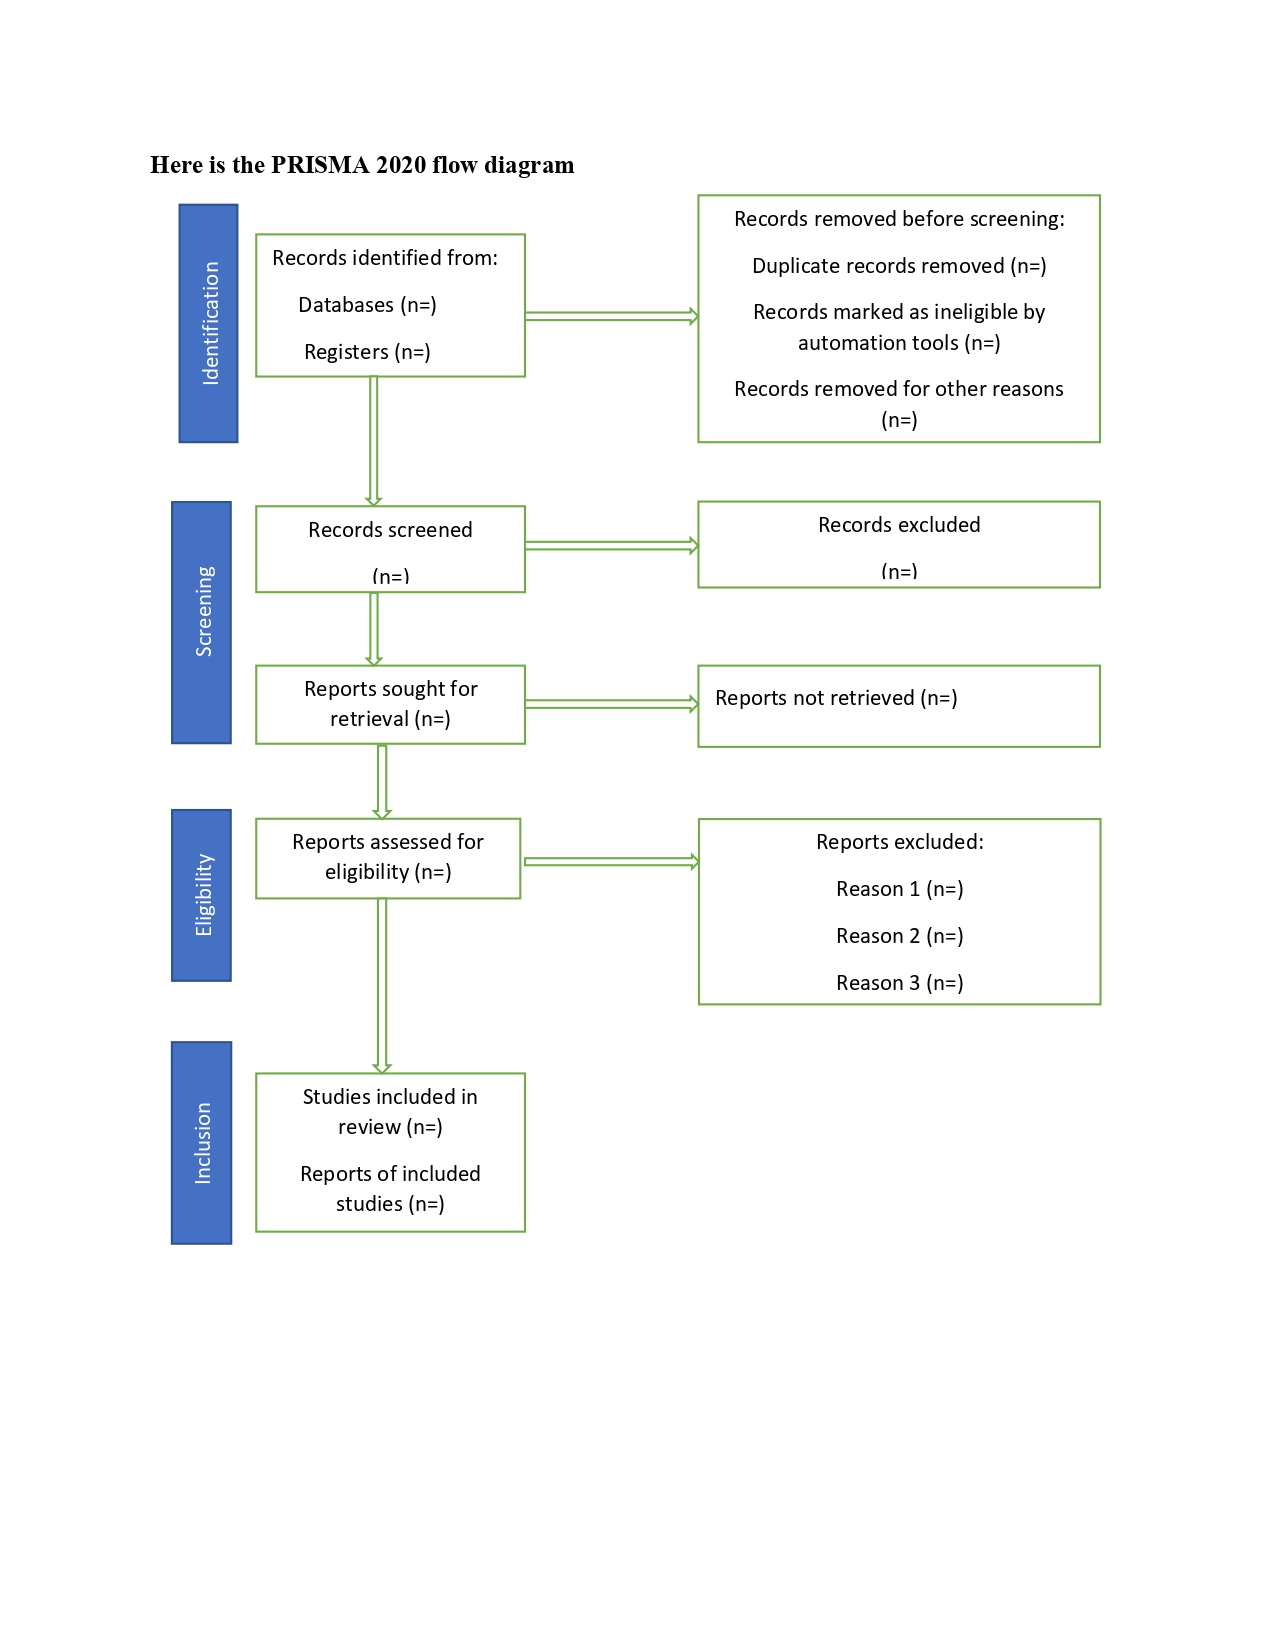
All the work described in the PRISMA diagram is categorized into four stages:
- Identification- stage one is identifying the articles for review
- Screening- this stage includes screening the articles for review
- Eligibility- this step involves deciding on the eligibility of the studies
- Inclusion- the last step is finalizing the list of studies to include in your systematic review
To complete the PRISMA diagram, download/save a copy of it from the
PRISMA Website to use alongside your searches.
Let us have a look at the important terminologies used in the PRISMA 2020 flow chart
Report
It is a document- paper or electronic providing information about a certain study. It may be a clinical study report, a journal article, an unpublished manuscript, or any other document supplying relevant information.
Record
The title or abstract of a report indexed in a database or website. For instance, a title or abstract for an article indexed in Medline is a record. Records that refer to the same report are duplicates.
Study
An investigation such as a clinical trial that includes a defined group of participants and one or more interventions and outcomes. A study might have multiple reports. For instance, reports could be a statistical analysis plan, baseline characteristics, results for primary and secondary outcomes, results for harms, and so on.
PRISMA 2020 Flow Chart Explained:
Conducting the database search
Search each database separately (use at least 5 databases). Do not forget to include all your keywords, subject headings, truncation, and wildcards. Use all your limits, including years of search, language, and others. Once you have combined all the searches without omitting any important limits, you should come up with the final number of records or studies for each database. Fill in the top left box of the PRISMA diagram with that information. Enter the number of combined searches from all databases, including duplicates. This should go after the equal sign stating – Databases (n=). If you search trial registers, that number should be added after the equal sign Registers (n=).
Remove all Duplicates
You need to eliminate any article that appears more than once in your search results to avoid reviewing duplicate papers. Duplicates can be removed manually through excel software or electronically through a reference manager. You can transfer the list of articles to a citation manager such as Mendeley or Endnote to remove duplicates. Add the number of articles removed as duplicates in the top right box in the PRISMA flow chart.
Records Screened- Titles and Abstracts
Once you have removed the duplicates, the next step is to enter the number of studies you will screen. You should get this number by subtracting the number of duplicates from the number of records identified.
Records Excluded- Titles and Abstracts
This step includes screening the titles and abstracts for articles relevant to your topic. Include any articles that seem to help you answer your research question. It is important to have two people go through the articles’ titles and abstracts and identify which ones are relevant to your research questions. Add the number of articles excluded in the box named “Records excluded.” If you found that the article should be excluded, remember to note the reason for exclusion. Also, if there are disagreements between the two readers regarding whether the article should be included or excluded, they should be resolved by discussions or involving a third reader.
Reports Sort for Retrieval
This is the number of articles remaining for full-text screening. This should be the total number screened minus the number of excluded records.
Reports Not Retrieved
In this box, list the number of articles for which you did not find the full text. Find full papers, both published and unpublished, and add the number of studies you could not get full text.
Reports Assessed for Eligibility- Full-Text Screening
This is the number of reports sought for retrieval minus the number of reports not retrieved. In this step, you have to remove some reports. Read the full text and do the quality check. Just like the title and abstract screening, you can have two people read the full text of all articles.
Reports Excluded
After reviewing all articles, note the total number of all articles you exclude in the box named “reports excluded.” You must state the reason for exclusion and the number of articles under each reason for exclusion.
Included Studies
You find the number of included studies by subtracting the number of records excluded during the eligibility review of full papers from the total number of articles reviewed for eligibility. Your PRISMA flow chart is now complete unless you conducted searches in non-database sources.
Keep in mind that not all studies that are eligible for the systematic review may be eligible for the meta-analysis.